Viewing Test Reports of Completed Sessions
- 02 Aug 2024
- 1 Minute to read
- Print
- DarkLight
Viewing Test Reports of Completed Sessions
- Updated on 02 Aug 2024
- 1 Minute to read
- Print
- DarkLight
Article summary
Did you find this summary helpful?
Thank you for your feedback!
Once a user is done with testing and release the device, a report is generated for the review. User can check it by navigating to the Report tab, selecting the desired session and clicking on icon present under action.
Pcloudy prepares below mention details for users to analyze:
| Feature | Description |
|---|---|
| Maximum CPU Usage | Peak percentage of CPU capacity used by the app during the session. |
| Average Memory Usage | Average amount of memory consumed by the app during the session. |
| Maximum Memory Usage | Peak amount of memory consumed by the app at any point during the session. |
| Average Battery Usage | Average percentage of battery consumed by the app during the session. |
| Maximum Battery Usage | Peak percentage of battery consumed by the app at any point during the session. |
| Network Usage | Total network data downloaded and uploaded by the app during the session. |
| Application Not Responding (ANR) | Number of times the app's UI thread did not respond |
| App Crashes | Number of times the app crashed during the session |
| Activity Load time | Time it takes for the app’s screen to fully load and become interactive |
| Graphics Processing Unit | Peak percentage of GPU used by the app during the session |
| Maximum GPU Usage | Peak percentage of GPU used by the app during the session |
| Average GPU Usage | Average amount of GPU consumed by the app during the session |
| Snapshot | User can check all the snapshot from here. |
| Logs | User can download check the logs of app under test. |
| Videos | User can view whole video of his/her app testing. |
Steps to View Reports of Completed Sessions
- Simply navigate from Reports > All Reports > Select the test_file name >click on Action button for it.

- Select the desired session name and click on the icon present under action.
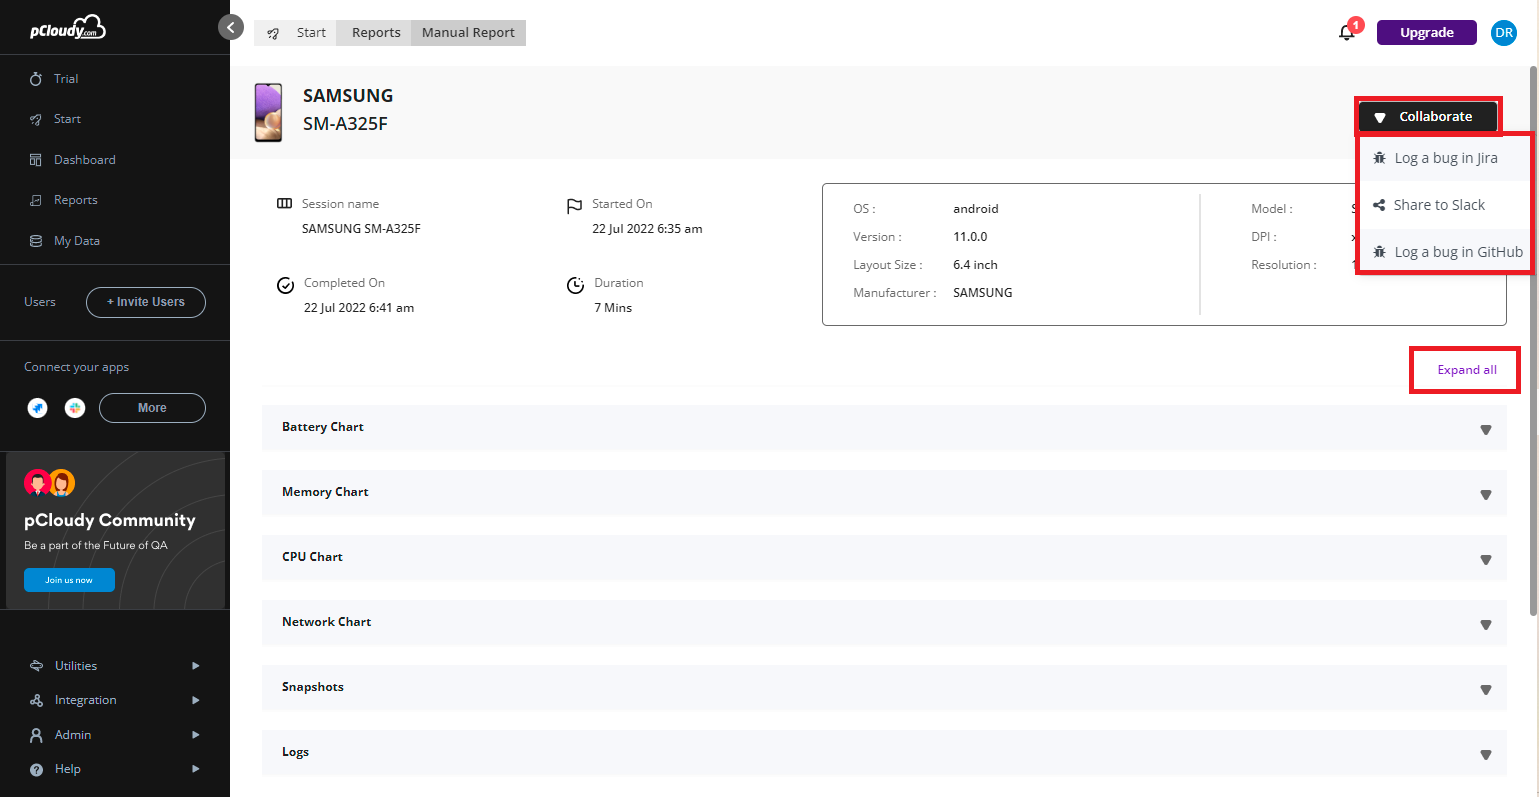
- The user will able to see the selected device details, Performance charts, logs, snapshots and videos for the session selected.
- If a user finds any bug while reviewing the report, he/she can directly use the Collaborate button to log a bug in JIRA.

Was this article helpful?


